If your dashboard cannot show time-weighted and money-weighted returns, you are steering blind. Use brokerage reports or Google Sheets XIRR to separate market impact from contributions and withdrawals, and turn noisy performance into honest evidence.
Morningstar’s portfolio tools surface fees, style tilts, and hidden overlap across funds. Use X-Ray to see sector and geographic exposure, then compare your blend against a benchmark to spot concentration risks before they turn into avoidable surprises.
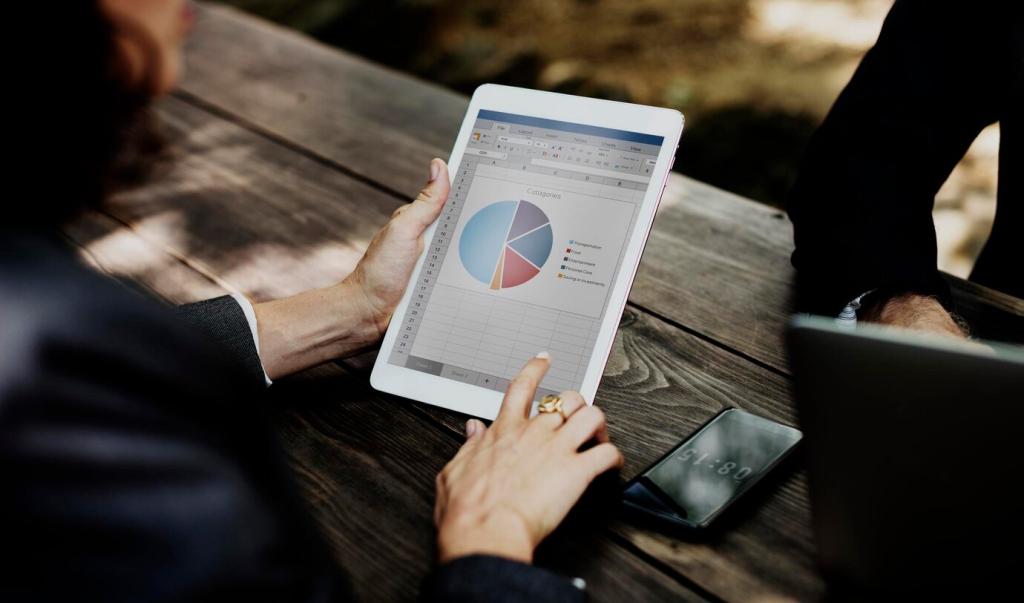
Google Sheets + IMPORT Functions
Build a living dashboard with Google Sheets. Pull quotes, track contributions, and calculate XIRR and time-weighted returns. Add conditional formatting for alerts, and maintain a tidy tab for benchmark comparisons that keeps your expectations realistically grounded.
Brokerage Dashboards Done Right
Your brokerage already tracks performance—learn its settings. Enable time-weighted returns, export lot-level data, and schedule monthly statements to your archive. Use realized gain reports to understand taxes and to separate skill from lucky timing.
Charts, Screens, and Alerts
Create clean watchlists, anchor levels, and price alerts on TradingView. Use multi-timeframe charts to avoid tunnel vision, and save templates so your rules—not your mood—decide when to review, rebalance, or simply do nothing at all.
Upload holdings to Portfolio Visualizer to see factor exposures, run backtests, and compare strategies. You’ll learn if your returns lean on size, value, or momentum—and whether you’re doubling the same bet across funds without realizing it.
Risk, Factor, and Scenario Analysis
Track standard deviation, maximum drawdown, and recovery time alongside returns. Whether via Sheets or broker analytics, these metrics expose the emotional cost of your approach, letting you calibrate position sizes before volatility tests your patience.
Fees, Taxes, and the Hidden Drags
Fee Tracking and Expense Ratios
Use Morningstar data and a Sheets model to compute your blended expense ratio across funds. Even tiny reductions compound. A quarterly fee audit often frees performance you would otherwise chase with riskier bets and restless trading.
Tax-Loss Harvesting Dashboards
Lot-level unrealized loss views in your brokerage help identify harvest opportunities. Track holding periods, watch for wash-sale risks, and document replacement pairs. Over years, disciplined harvesting can lower taxes and smooth volatility without chasing shiny objects.
Dividend and Distribution Calendars
Keep a dividend calendar that flags ex-dates, yields, and qualified income percentages. Knowing what, when, and how you’re paid improves cash planning, prevents surprise distributions, and aligns reinvestment with your rebalancing and liquidity needs.
Allocation, Rebalancing, and Discipline
The Policy You Can Actually Follow
Draft a one-page Investment Policy in Google Sheets: target allocation, contribution schedule, risk limits, and what triggers a review. Link your trackers so every metric points back to the plan you promised yourself to keep.